$174B
US labor a year spent by 3.6M workers building and revising 3D worlds; ≈$0.6T globally.
BLS OEWS May 2025; BLS ECEC 2026
The next capability
Spatial Work: Can coding agents program the spatial world?
Spatial Work is the creation and editing of structured, executable representations—from objects and buildings to scenes and cities. Enactra benchmarks agents across real-world reconstruction — one building, then a whole city — along with text-to-scene and image-to-scene, then turns their failures into training data and interactive RL environments.
Spatial Work requires coding agents to generate a wide range of digital assets across industries and software — Revit and SolidWorks for CAD (.ifc, .step), Unreal and Unity for games (.umap), Maya and Houdini for film (.usd), ArcGIS and Cesium for cities (CityGML), ROS and Isaac Sim for robots (.urdf), CARLA for driving (.xodr), and .glb for the web, AR and simulation assets. Every one of them is a typed file some machine downstream has to consume, not a picture of a thing.
Market survey
World construction is a real economic bottleneck
$174B of US labor a year goes into building 3D worlds — one-third of what coding costs — and almost none of it is automated.
~100 hrs
Skilled hours to model one small building as-built from its scan; a game landmark like Notre-Dame takes 5,000.
Concrete Bureau 2026; Ubisoft 2014
6% vs 84%
Architects using AI regularly vs software engineers using AI tools.
AIA 2025; Stack Overflow 2025
Where the capability creates value
Digitally executable labor, and the market whose finished deliverable is a digital world.
Buildings & AEC
$87Blabor / yr
$403Bdigital market
1.79M architects, engineers, drafters and construction managers. Design, as-built, renovation, inspection.
Games & film
$10Blabor / yr
$190Bdigital market
Game environments, film and TV VFX, animation, virtual production. The deliverable is the world itself.
Cities & digital twins
$10Blabor / yr
$12.5Bdigital market
188k planners, surveyors, cartographers and GIS technicians. Terrain, footprints, road networks, city models.
Physical AI
~$4Blabor / yr, est.
$2.25Tphysical labor
Simulation worlds for robot and AV training. Behind it: 42.7M US workers in physical jobs.
Products & machines Expansion
$63Blabor / yr
in the $403Bdigital market
1.36M mechanical, aerospace, industrial and electrical engineers. Parametric CAD and assemblies.
The benchmark gap
Tasks whose deliverable is spatial — every task in both public sets, read one by one.
The one 3D deliverable in all 220 tasks is a flashlight concept — no building, no scene, no world.
Only two of the nine reach building scale. And those two are checked rather than measured: the right file format, enough vertices, a few preset views.
Spatial Work matters, but these benchmarks sample the whole economy, too sparsely to optimize either tasks or verifiers for it. Ours is built for this one category — tasks and verifiers both.
The remaining frontier
Reconstruct the same real place
Generation benchmarks focus on appearance or geometry. VWE-Bench supports multi-turn editing and RL, but mainly composes predefined assets from text.
Real aerial and street imagery → hidden-structure reasoning → an editable, executable world → inspection, repair, and dense evaluation
Sources & method
Labor = employment × mean wage × 1.429 loaded multiplier × digitally executable share. BLS OEWS May 2025; BLS ECEC March 2026. 32 BLS occupations give $164B; rows are cut from the OEWS occupation-by-industry table, with the cells BLS suppresses allocated pro rata. Games & film adds ~$6B of 3D roles BLS files under software occupations (~80k US game and film artists × $115k × 1.429 × 0.7 digitally executable share). Coding measured the same way: $471B. ~100 hrs: Concrete Bureau, data from 35 delivered scan-to-BIM projects — a building under 2,500 m² at LOD 300–350 takes 105–240 modeling hours for architecture, structure and MEP, of which architecture and structure are 50–60% (≈60–130 hrs). Consistent with a published 1,250 m² case: 96.5 desk hours, 68% manual modeling (Rocha et al., Heritage 2020). 5,000 hrs: Ubisoft senior level artist Caroline Miousse's own estimate in a Ubisoft Q&A, ~5,000 hrs over 14 months for Notre-Dame in Assassin's Creed Unity (2014). Digital market: Census AIES 2023, NAICS 5413 — architecture, landscape, engineering, drafting and building inspection $403.5B; surveying and mapping $12.5B; testing laboratories ($28.9B) excluded. Engineering services ($341B) has no NAICS split by project type, so product engineering sits inside the $403B. Film & TV $138B (Census QSS 2025, NAICS 512) + video-game content $52.4B (ESA 2025). Physical AI labor: our estimate, ~15k US simulation engineers × $200k loaded; no BLS occupation code exists for the role. The robotics synthetic-data market it serves is $2.5B, growing 33% a year (The Business Research Company, Feb 2026). $2.25T: annual labor of 42.7M US workers in physical jobs (five BLS major groups: production, construction, installation and repair, transportation, healthcare support). Construction and manufactured goods ($9.8T) are what this work specifies, not what it sells, and are excluded. Benchmark audit: task-by-task read of the released datasets. GDPval gold set (HF openai/gdpval, 220 tasks): deliverables are office documents almost throughout (PDF, XLSX, DOCX, PPTX); the one 3D deliverable is a flashlight CAD model in STEP format (Mechanical Engineers). ALE v1.0 public set (HF agents-last-exam, 153 task cards): building-scale construction is 2d_drawings_to_3d_bridge_model and 2d_drawings_to_3d_building_model, both Rhino 8, PDF drawings in, OBJ mesh out, a render of the finished answer staged in the agent's inputs, acceptance via magic-byte gates, vertex-count minimums and preset evaluator views; the remaining spatial-subdomain tasks are asset-scale (rig, UV, URDF, one tabletop scene) or simulation and analysis in real software (Civil 3D, PLAXIS, SUMO, Moldex3D).
Meanwhile, coding agents are starting to build worlds
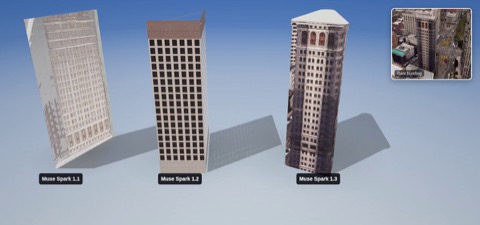 Alexandr Wang agentic spatial simulation shows how fast AI evolves, on X
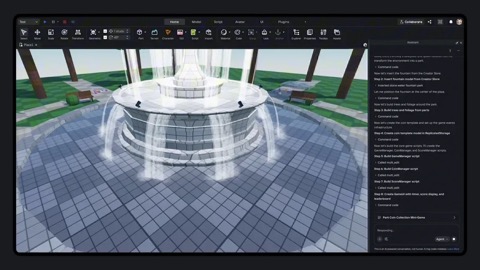 44% of Roblox’s top creators use AI — Studio is going agentic
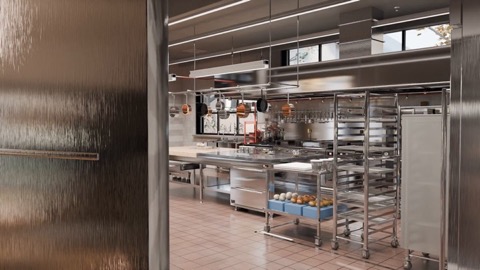 6.2K likes GLM-5.3 builds a dream kitchen in Blender, on X
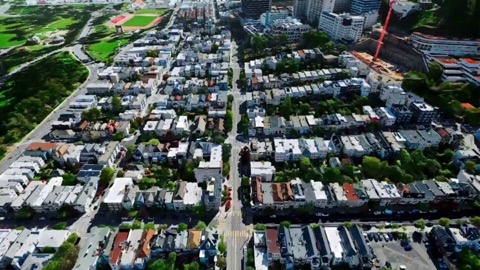 6.7K likes San Francisco turned into a playable world, on X
 And the first real commission ↗
Beijing’s Haidian district opened 43.6 km² of real urban planning to agents only.
From the North 5th Ring to Beijing North Station — larger than Macau — with selected proposals going forward into implementation, and Claude Code named among the agents invited to enter. This is one submission: a nine-kilometre spine along the 1909 Jing–Zhang railway, drawn, argued and costed as a full design report.
Flagship task
Building reconstruction from real-world evidence
We begin with a concrete test: given aerial and street-level imagery, an agent must recover a coherent, executable 3D building—not merely produce a plausible image.
Agent input
10 evidence images
Given: 10 photographs, exact camera poses, and a map-derived footprint.
Withheld: building height and 5 evaluation views.
Agent reconstruction
Claude Opus · executable glTF
157turns
70.7 minwall clock
$27.29run cost
Evaluation
Claude Opus
Overall score
0.736
Silhouette0.867
Height accuracy97.3%
Structure0.891
Surface F @ 0.5 m0.290
Overall and structure are normalized benchmark scores. Silhouette and Surface F are raw measurements.
Valid executable output
2,336 triangles · 32.50 m reconstructed height vs. 31.66 m measured
2,336 triangles · 32.50 m reconstructed height vs. 31.66 m measured
What this reveals: Opus recovers the building’s stepped massing and height, while fine surface agreement remains much lower. The benchmark turns that visible gap into a precise training signal.
Evaluation breakdown
The blind tier grades each submitted glTF against held-out images, point clouds, and the file itself. Scores are normalized so 0 is the building's bounding-box baseline and 1 is perfect.
OverallThe benchmark's normalized measurements receive equal shares. Equal weighting performs as well as weights fitted to held-out human preferences.
Surface agreementPrecision, recall, and F at a 0.5 m tolerance, plus Chamfer distance between the submission and truth point clouds.
GeometrySilhouette 45% · outline 20% · plan 20% · height 15%, measured from held-out camera views.
AppearanceColour 40% · façade structure 30% · materials 30%. Materials are read directly from the submitted glTF.
Held-out consistencyThe agent receives 10 photographs and camera poses; 7 additional cameras test whether the reconstruction works beyond the observed views.
Reliability & effortAcross-building SD, repeat SD, cost, turns, and runtime are reported separately. The measured overall noise floor is 0.05–0.09.
Leaderboard
Blind tier · snapshot 2026-09-03 · the shared set: every model over the same 11 buildings · 21 models. Hover any dot for that model's numbers; sort any column below.
Solid: the frontier — nothing cheaper scores higher, by a margin this bench can measure. Whiskers: one standard error either way, each model’s own. One dot per ranked model, at every reasoning effort it has been run at, named model (effort). Overlap is not the test: whiskers are ±1 s.e. (≈68%), each over that model’s own buildings — whether two models are truly separated is decided by the paired test on the buildings both ran, in the note below.
FamilyEffort
Nothing matches these filters.
How the ranking is measured
The blind tier only — neither given. One number per model: the mean of its overall over the shared set — the 11 buildings every ranked model has run, with repeats averaged into the building first. Coverage is identical across rows by construction, so the rows are directly comparable; models that have not finished the shared set are not ranked here. Every other column on every tab is aggregated the same way, over that row's own buildings. The standard tier is a board of its own and is not averaged in: it asks a different question of the same buildings (footprint given, height read off the photographs), and rolling the two together would rank a model partly on how much it was told. The ± is that model’s own standard error: the deviation of its score from one building to the next, over the root of how many buildings it was ranked on. Repeats are averaged into the building before that is taken, so running one cell four times tightens the number rather than counting four times. It is blank where nobody has run that model twice, which is not the same as zero, and it is absent from the same set view altogether, because that view takes one run per building so that no row rests on more attempts than another. The # column is the position in the current sort, nothing more — most single steps of this table cannot be statistically separated. That is tested pair by pair on the buildings both of them ran — the difference building by building, which takes out how hard the building was, since that part is the same for both — and 27 of the 27 steps down this table do not survive it. With this few buildings, only the ends of the table are separated; that is the state of the evidence, not a fault in the table. Which buildings each row has, and which ones every row has, is in what each row is a mean over below.
How the chart is measured
The whisker through each dot is one standard error either way, and it is that model’s own: the deviation of its score from one building to the next, over the root of how many buildings it was ranked on. Repeats are inside those per-building scores already, averaged in before the mean is taken, so a cell run four times is one building’s worth of evidence with a tighter number on it. These bars are not all the same size — they run from 0.014 to 0.083 on this board — because what moves this score is which building far more than which afternoon. Where two dots are closer together than their bars are long, their order is not a result.
The solid line is the frontier: for every model on it, nothing beats it by more than this bench can measure — 0.027 on the score, the middle model’s standard error, and 15% on the cost, which is measured by running the same cell twice. A strict reading of “nothing cheaper scores higher” put a model on the line for costing two cents less than one scoring 0.079 above it, and two cents is not a decision anybody makes. Only the models on the frontier are named on the plot; every other point is a dot, and pointing at one says which model it is, what it is ranked on, and how far it moves.
The reasoning effort is part of the name — claude-opus-5 (high) is that model at its own default, because no lane has ever been given --effort and high is what the 5-series resolves to. A name with no bracket is a model that does not take the setting. Every setting is its own dot, and they are not joined up: the distance between one model’s settings is smaller than these bars, so two of them sitting apart is not yet evidence that thinking harder helped. Running the same cell again moves it by 0.106 on its own, and every run that was measured on is on the runs page.
Cost is the median of one run of that model, read off the agent CLI’s own ledger. Where it does not — the Gemini CLI reports tokens but no price — the run is priced from its own recorded tokens at the published list of 2026-08-25, cached prompt at the cached rate and thinking billed as output. Those rows carry an est. price tag, because an estimate and a bill are not the same fact.
Gallery
Claude Fable against Google's Photorealistic 3D Tiles, one shared camera. Drag to orbit both; the wipe divides the real place from the reconstruction.
Claude Fable
Overall .270
Ground-truth
Claude Fable
Loading models
Flatiron Building
Claude Fable
Overall .535
Ground-truth
Claude Fable
Loading models
S.R. Crown Hall
Claude Fable
Overall .618
Ground-truth
Claude Fable
Loading models
San Francisco Ferry Building
About these numbers
Scores are from the live benchmark snapshot for the standard Claude Fable submission. Surface F measures reconstructed surface agreement; silhouette measures matched-view shape consistency.
Rendering runs in your browser with the benchmark's own lighting rig and camera convention — the reference and the reconstruction share one camera, so a difference between the halves is a difference in the building, never in the view. If the tiles cannot stream, the exported ground-truth mesh stands in.
What current agents get wrong
Two scored Claude Fable runs beside the ground truth, on the benchmark's own cameras. The columns say where each went wrong.
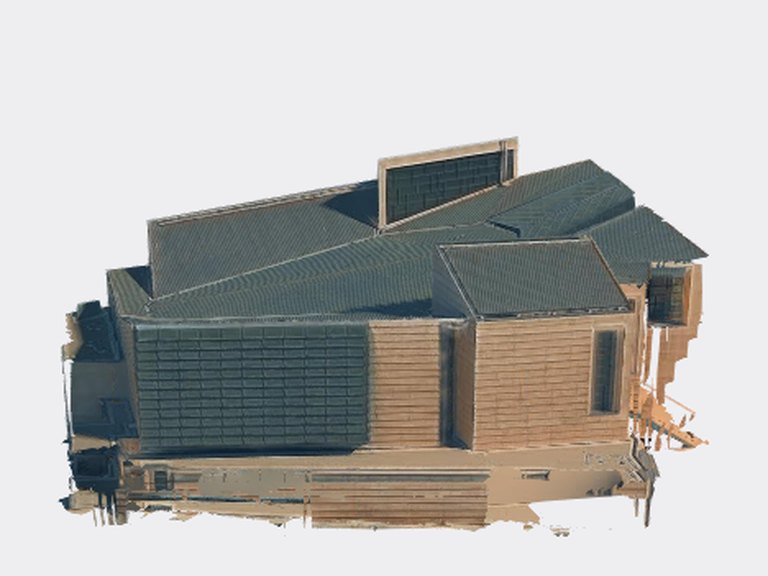
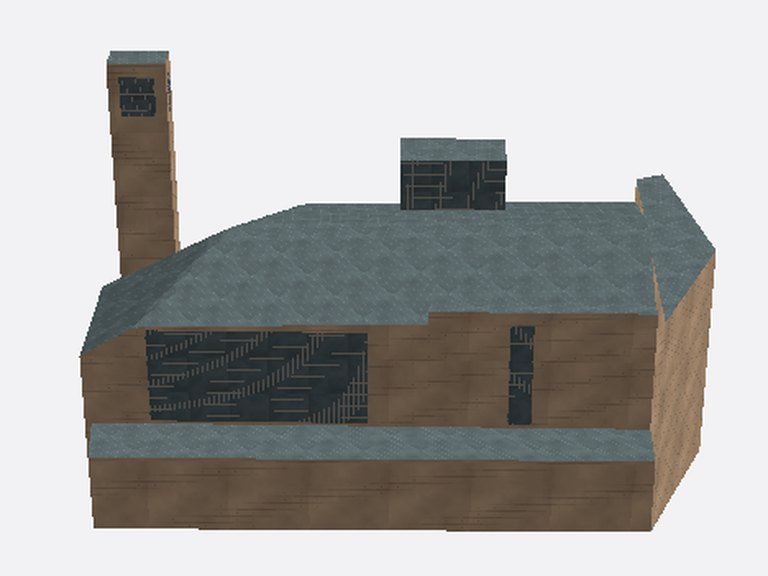
Cathedral of Our Lady of the Angels
Overall 0.642
Straightens what the architect bent
Surface F 0.15Outline 0.50Height 0.23
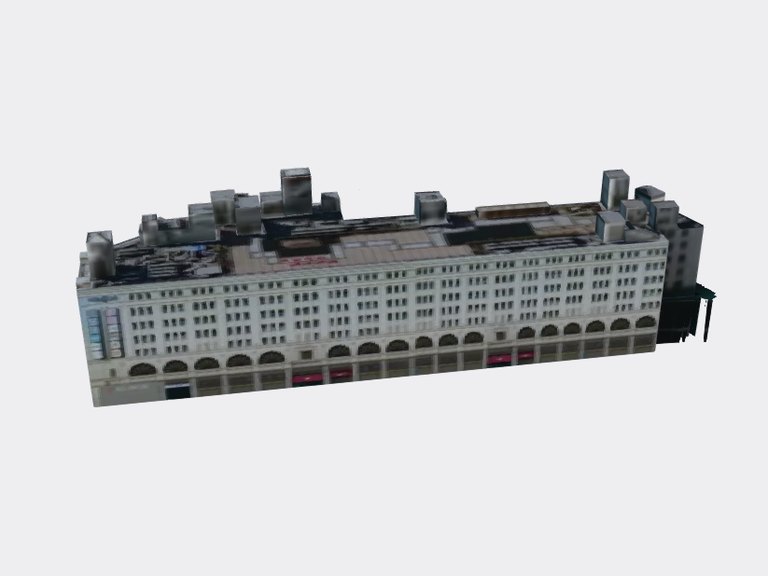
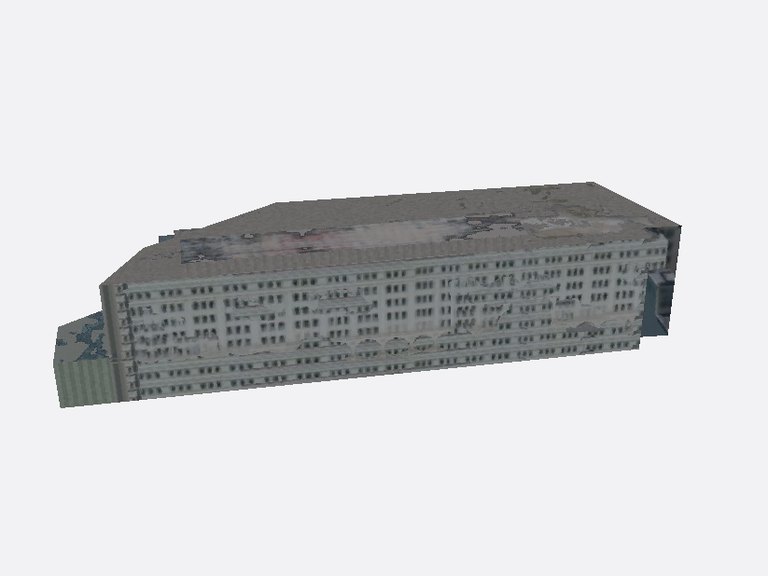
EKIMISE Asakusa
Overall 0.644
Paints the detail instead of building it
Surface F 0.11Mesh density 0.39Structure 0.93
Broader task family
One infrastructure, four ways to build worlds
Building reconstruction provides the deepest evaluation. The same task, environment, and evaluation infrastructure scales out to a whole city, and across to language-grounded and image-grounded scene construction.
City reconstruction · interactive examples
Reconstruct Sunnyvale, a real city
A kilometre of downtown rebuilt as an executable world — buildings, streets and the rail corridor — then flown, railed and driven through inside the engine.
~1 km of downtown
generated city · one camera path each
Rendered in the engine from the generated city graph. Each camera path is also run frame-for-frame beside Google Earth's photorealistic mesh of the real Sunnyvale; shown here are the reconstruction's own renders.
Text-to-scene · interactive examples
Claude Opus 5
Language → executable spatial world
From a natural-language specification, the coding agent composes a complete 3D environment that can be rendered, inspected, and evaluated.
Text prompt
Built by Claude Opus 5
Image-to-scene · interactive example
Repair a 3D scene from visual evidence
The agent must understand what is wrong, edit the executable scene, and preserve everything else.
GPT-5.6-sol
GT repair 0.769 · target 0.727
Repair instruction
Move the displaced rear-lane bench back beside the lamp post, then restore its orientation and scale. Preserve every other scene actor.
View
Switch views to verify the repair from three synchronized cameras.
What Enactra provides
Co-design a private evaluation pilot
The complete stack for teaching agents to build the spatial world.
We begin by measuring where models fail, then provide the data and environments needed to improve both coding agents and the vision models behind them.
Leaderboard & evaluationPublic and private benchmarks with interpretable scores, galleries, and failure analysis.
Agent data & harnessCurated tasks, trajectories, tool interfaces, and evaluators for training coding agents.
RL environmentsInteractive executable worlds with dense rewards for training, repair, and held-out evaluation.
Video dataControllable multi-view video with geometry, camera, object, and physics ground truth for world and vision models.